
Bitcoin (BTC) witnessed a notable decline after hitting a new all-time high above $106,000 on December 17. Bitcoin Rainbow Chart Before briefly breaking the $92,000 barrier and rising again in early January, the price of the top cryptocurrency fell back down to $95,000.At the time of publication, the price of Bitcoin was around $98,850. This represents a 125.25% rise over the same period in 2024 and a 5.18% increase since the beginning of 2025.
Rainbow Chart and Market Sentiment
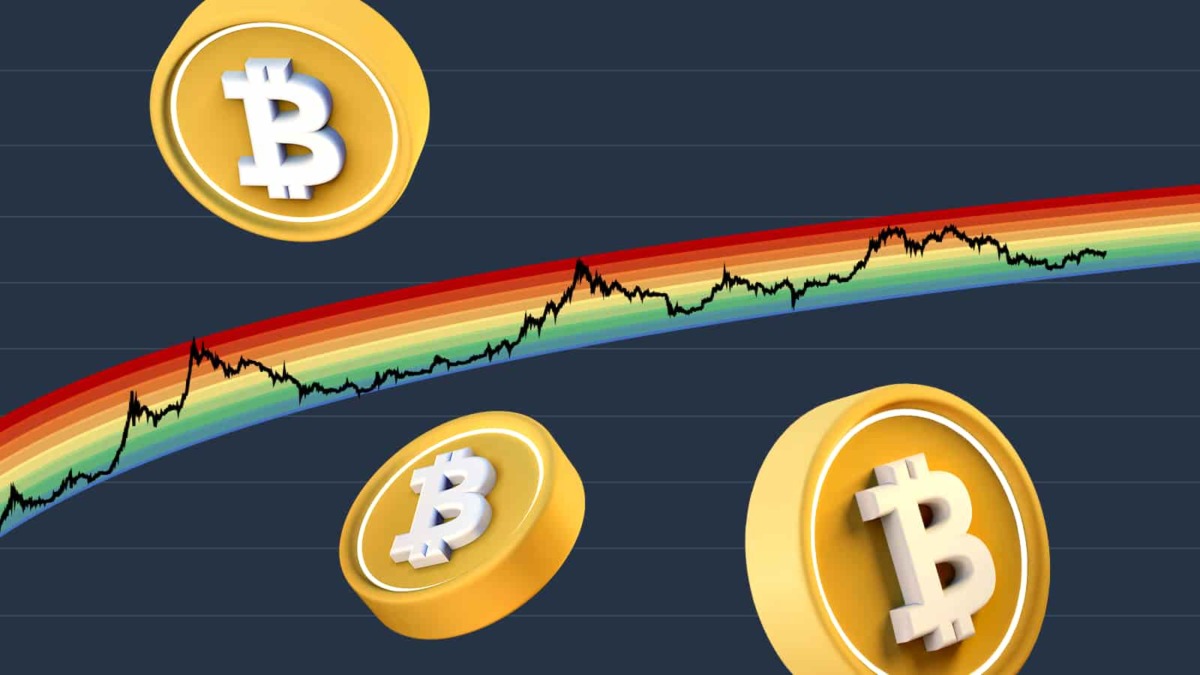
No one knows for sure how high it will go, and predictions vary substantially, but most analysts are optimistic and believe it will keep climbing. A specialist in the Bitcoin market determined our current position in the cycle by consulting the Bitcoin Rainbow chart, which can provide additional insight. The market sentiment and Bitcoin price levels are graphically represented by the Rainbow Chart. It uses nine zones colour-coded to demarcate price points. The current price levels of Bitcoin indicate that it is not overbought, suggesting that analysts are using it to gauge market mood.
It seems like the last cycle was missing the usual degree of excitement for Bitcoin. Consequently, as post-traumatic stress disorder comes in, the bar for this cycle drops significantly. Even if Bitcoin’s price suddenly skyrocketed from $110,000 to $150,000, as van de Poppe pointed out, it would still be trading within the zone. By contrast, the dominating digital asset’s prices would have to jump above $250,000 before they could be deemed overbought.
Analyzes Bitcoin’s Rainbow
Using a logarithmic growth curve, a Rainbow Chart illustrates the relationship between price levels and investor sentiment. Bitcoin Rainbow Chart There are nine distinct areas on the chart, each with its own colour indicating a distinct price range and current market sentiment. Within each of these zones, you’ll find a broad spectrum of opinions, from Bitcoin being dead very negative at the very bottom to Maximum Bubble Territory, extremely bullish at the very top, where you’ll often see steep corrections.
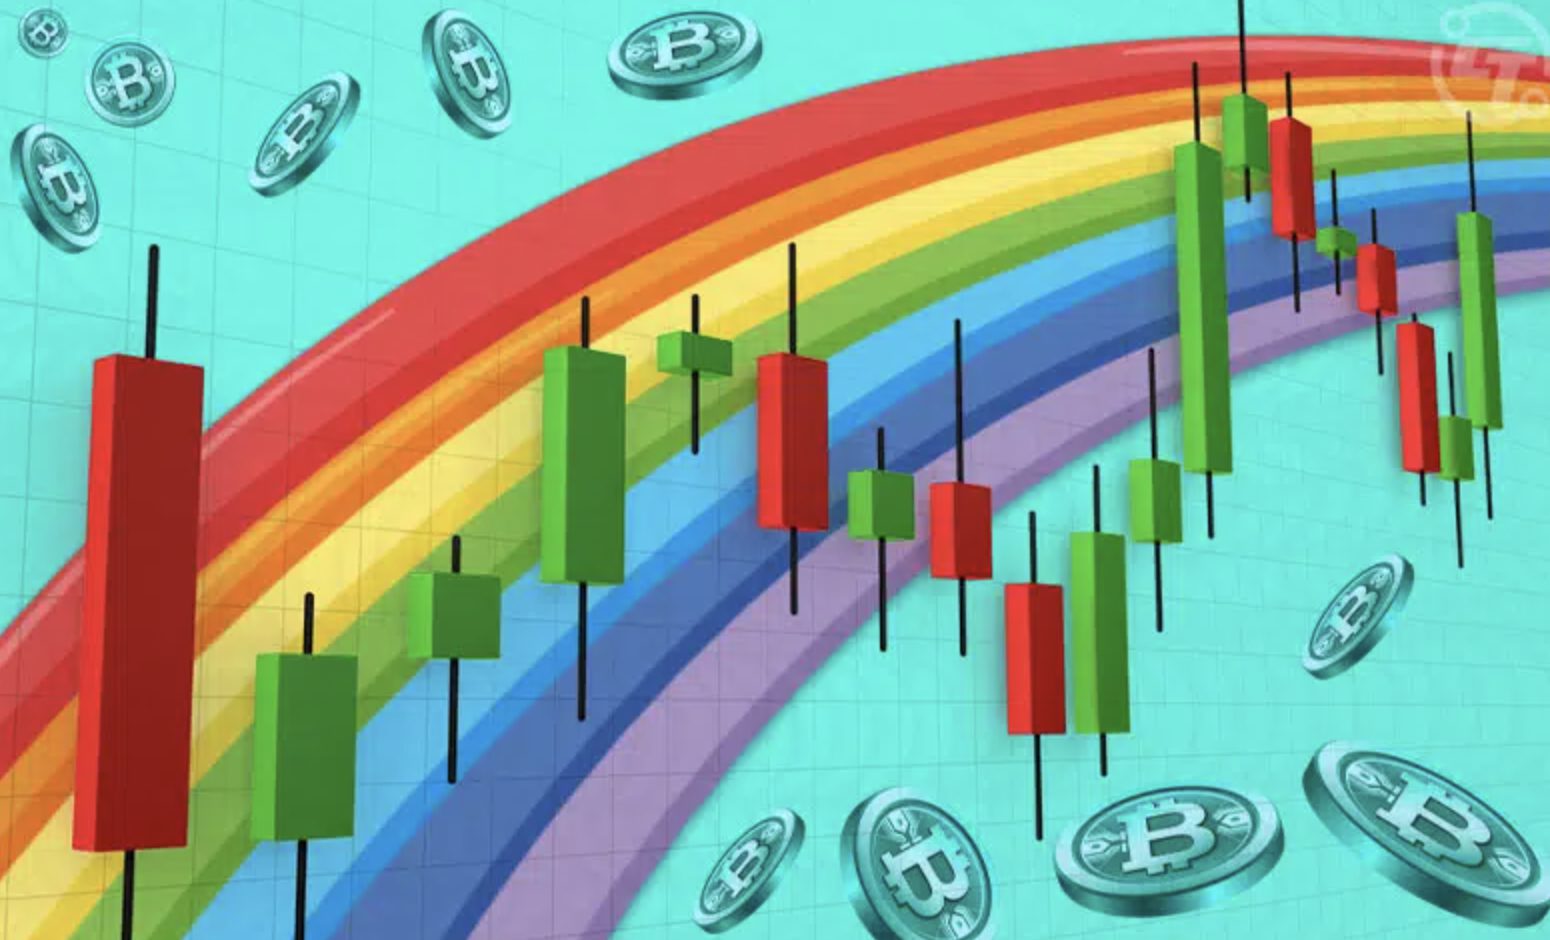
In a post on January 5 on the social networking platform X, the Rainbow Chart was lauded as an attractive indication by the renowned cryptocurrency researcher Michaël van de Poppe. Van de Poppe claims that, as of this writing, Bitcoin is trading at $98,850, firmly situated in the bottom half of the chart where the accumulated bands meet. The Rainbow chart is a visually appealing Bitcoin indicator.
BTC Market Outlook Reversal
Van de Poppe attributes the significantly lower expectations this time around, even going so far as to call it PTSD to the fact that the prior market cycle did not provide the usual enthusiasm and buying pressure, as seen in the long-term rainbow chart. The BTC market outlook suggests a potential reversal in Bitcoin’s price cycle. After a surge in late 2024, the price dipped, but analysts predict a recovery. According to the Rainbow Chart. Bitcoin could reach a major price threshold of around $375,000.
A possible surge to $470,000 by mid-2025.The researcher pondered the fact that, according to the Rainbow Chart, extremely overbought levels change over time. There is a strong probability of a reversal around the $375,000 mark, but by August, that level will have shifted to $470,000.The analyst restated his long-standing positive attitude, saying the current market cycle will be extreme and very similar to the price movement seen between 2014 and 2017.
Summary
In December 2024, Bitcoin Rainbow Chart Bitcoin hit a new of over $106,000. However, by early January 2025, it had fallen to roughly $95,000. There was a 125.25% growth in 2024 and a 5.18% increase in 2025, with Bitcoin’s price reaching $98,850 at the time of publication. Despite the optimistic sentiment, analysts continue to disagree on how much further Bitcoin can rise. Even with price spikes near $150,000, Michaël van de Poppe used Bitcoin.
Rainbow Chart to show that Bitcoin is still in the zone. A possible price reversal is around $375,000, with a possible increase to $470,000. August is predicted by the chart, which shows investor emotion as overbought levels fluctuate over time. The market cycle will be similar to the bull run from 2014 to 2017, according. Van de Poppe continues to have an optimistic view.