Bitcoin Price Forecast Turns Bearish as Bear Flag Targets $36K the Bitcoin market has entered a critical phase as technical signals, weakening sentiment, and aggressive selling pressure converge. The latest Bitcoin price forecast has turned increasingly cautious after a classic bear flag pattern was confirmed on higher timeframes. As sellers dump BTC and momentum indicators roll over, traders and investors are closely watching whether the market will slide toward the psychologically significant $36K level.
Bitcoin has always been a market driven by narrative, liquidity, and technical structure. During bullish periods, optimism fuels strong rallies, while during corrective phases, fear and uncertainty can accelerate declines. The current setup reflects a market caught between long-term belief in Bitcoin’s value and short-term technical weakness.
We will provides an in-depth Bitcoin price forecast, explains the implications of a confirmed bear flag, analyzes why sellers are gaining control, and explores whether the $36K zone could become a realistic downside target.
Bitcoin Price Forecast
Bitcoin’s recent price action has shifted from consolidation to breakdown, signaling a potential change in trend. After failing to sustain higher highs, BTC entered a corrective phase marked by lower highs and fading volume.
This structural shift is important because Bitcoin thrives on momentum. Once momentum weakens, short-term traders often exit positions, adding to selling pressure. The Bitcoin price forecast now reflects a market that is struggling to regain bullish control.
Market structure analysis shows that previous support levels are now acting as resistance, reinforcing the bearish outlook and strengthening the case for further downside.
What a Bear Flag Pattern Means for Bitcoin Price Forecast
A bear flag is a continuation pattern that typically forms after a sharp decline, followed by a period of consolidation that slopes slightly upward or moves sideways. This pause often traps late buyers before the next leg down.
In the current Bitcoin price forecast, the bear flag formed after a strong sell-off, with price consolidating in a narrow range. Once BTC broke below the lower boundary of the flag, the pattern was confirmed.
Technically, bear flags often project a downside move equal to the length of the initial drop. This projection aligns closely with the $36K region, making it a focal point for traders.
Why Sellers Are Dumping BTC at This Stage
Sellers dumping BTC is rarely driven by a single factor. Instead, it reflects a combination of technical, psychological, and macroeconomic pressures.
From a technical standpoint, the loss of key support levels has invalidated bullish setups. Traders who entered during consolidation phases are now cutting losses, adding to downward momentum.
Psychologically, fear increases when widely followed patterns like bear flags confirm. This creates a self-reinforcing cycle where selling pressure accelerates as confidence erodes.
The Role of Volume in Confirming Bearish Momentum
Volume plays a crucial role in validating any technical pattern. In the current scenario, declining volume during consolidation followed by a spike in selling volume during breakdown strengthens the bearish case.
This behavior suggests that buyers are stepping aside while sellers dominate market activity. In Bitcoin price forecasting, such volume dynamics often precede extended moves rather than short-lived dips.
Sustained selling volume reinforces the idea that the market is not merely correcting but potentially entering a deeper pullback.
Key Support and Resistance Levels to Watch
Support and resistance zones act as psychological and technical battlegrounds. Bitcoin recently lost a key support area that had previously attracted strong buying interest.
Once broken, this zone flipped into resistance, making it harder for BTC to recover. Each failed attempt to reclaim resistance adds weight to the bearish Bitcoin price forecast.
Below current levels, the $36K region stands out as a major support area due to historical price action and its psychological importance.
The Importance of the $36K Level in Bitcoin Price Forecast
The $36K level is not just another number on the chart. It represents a convergence of technical projections, historical demand, and trader psychology.
Historically, Bitcoin has shown strong reactions around round-number levels. These zones often attract both buyers looking for value and sellers aiming to push price lower.
If BTC approaches $36K, market behavior around this level will be critical in determining whether the decline stabilizes or accelerates further.
Momentum Indicators Signal Weakness
Momentum indicators such as relative strength measures and trend oscillators are currently pointing downward. These indicators reflect declining buying pressure and increasing bearish momentum.
In Bitcoin price forecasting, momentum shifts often precede price movements. When indicators fail to recover during consolidation, it suggests that bulls lack conviction.
This technical weakness supports the view that the bear flag confirmation is not a false signal but part of a broader bearish phase.
Moving Averages and Trend Confirmation
Moving averages provide insight into trend direction and strength. Bitcoin has slipped below key moving averages that previously acted as dynamic support.
When price trades below these averages and fails to reclaim them, it often signals a shift from bullish to bearish conditions. This alignment of moving averages reinforces the bearish Bitcoin price forecast.
Additionally, downward-sloping averages suggest that any short-term rallies may be met with selling pressure rather than sustained buying.
Market Sentiment and Its Influence on Price Action
Sentiment plays a powerful role in crypto markets. When optimism fades, even minor negative signals can trigger outsized reactions.
Currently, sentiment indicators suggest growing caution among traders. This cautious mood aligns with the technical breakdown and contributes to sellers dumping BTC. In such environments, rallies are often viewed as opportunities to exit positions rather than chances to accumulate.
Macroeconomic Factors Adding to Downside Risk
While technicals dominate short-term Bitcoin price forecasting, macroeconomic factors cannot be ignored. Broader financial market uncertainty often spills over into crypto.
Rising risk aversion, shifting liquidity conditions, and cautious investor behavior can amplify selling pressure in speculative assets like Bitcoin. These external pressures make it harder for BTC to stage a meaningful recovery while the bear flag remains active.
Long-Term Holders Versus Short-Term Traders
Bitcoin’s investor base includes both long-term holders and short-term traders. During bearish phases, their behavior diverges significantly.
Long-term holders often remain inactive, believing in Bitcoin’s long-term value. Short-term traders, however, react quickly to technical signals and sentiment shifts. The current decline appears driven largely by short-term selling, but sustained weakness could eventually test the resolve of longer-term participants.
Comparing Current Setup With Past Bear Flag Breakdowns
Historically, Bitcoin has respected bear flag patterns during downtrends. Past examples show that once confirmed, these patterns often lead to extended declines before a meaningful reversal occurs.
Comparing the current Bitcoin price forecast with previous cycles reveals similarities in structure, volume behavior, and sentiment. While history does not guarantee repetition, it provides context for why traders are taking the $36K target seriously.
Potential Scenarios if Bitcoin Reaches $36K
If BTC approaches $36K, several scenarios could unfold. Strong buying interest could emerge, leading to a bounce or consolidation.
Alternatively, a weak reaction at this level could open the door to deeper declines. The strength and speed of any rebound will be crucial in assessing whether $36K acts as a floor. Market participants will closely watch volume, momentum, and follow-through to gauge the next phase.
Risk Management in a Bearish Bitcoin Market
In bearish conditions, risk management becomes more important than aggressive positioning. Volatility can increase, leading to sharp moves in both directions.
For traders, respecting stop levels and avoiding emotional decisions is critical. For investors, understanding the broader Bitcoin price forecast helps align expectations with market reality. Periods of weakness often reward patience and discipline rather than impulsive action.
Is This a Temporary Correction or a Deeper Trend Shift?
One of the biggest questions surrounding the current Bitcoin price forecast is whether this move represents a temporary correction or the start of a deeper bearish trend.
The confirmation of a bear flag suggests continuation rather than reversal. However, markets are dynamic, and invalidation of the pattern could change the outlook. Until clear signs of strength emerge, caution remains the dominant theme.
The Role of Psychology in Bearish Breakdowns
Psychology amplifies technical patterns. When traders recognize a bear flag, their actions often reinforce the expected outcome.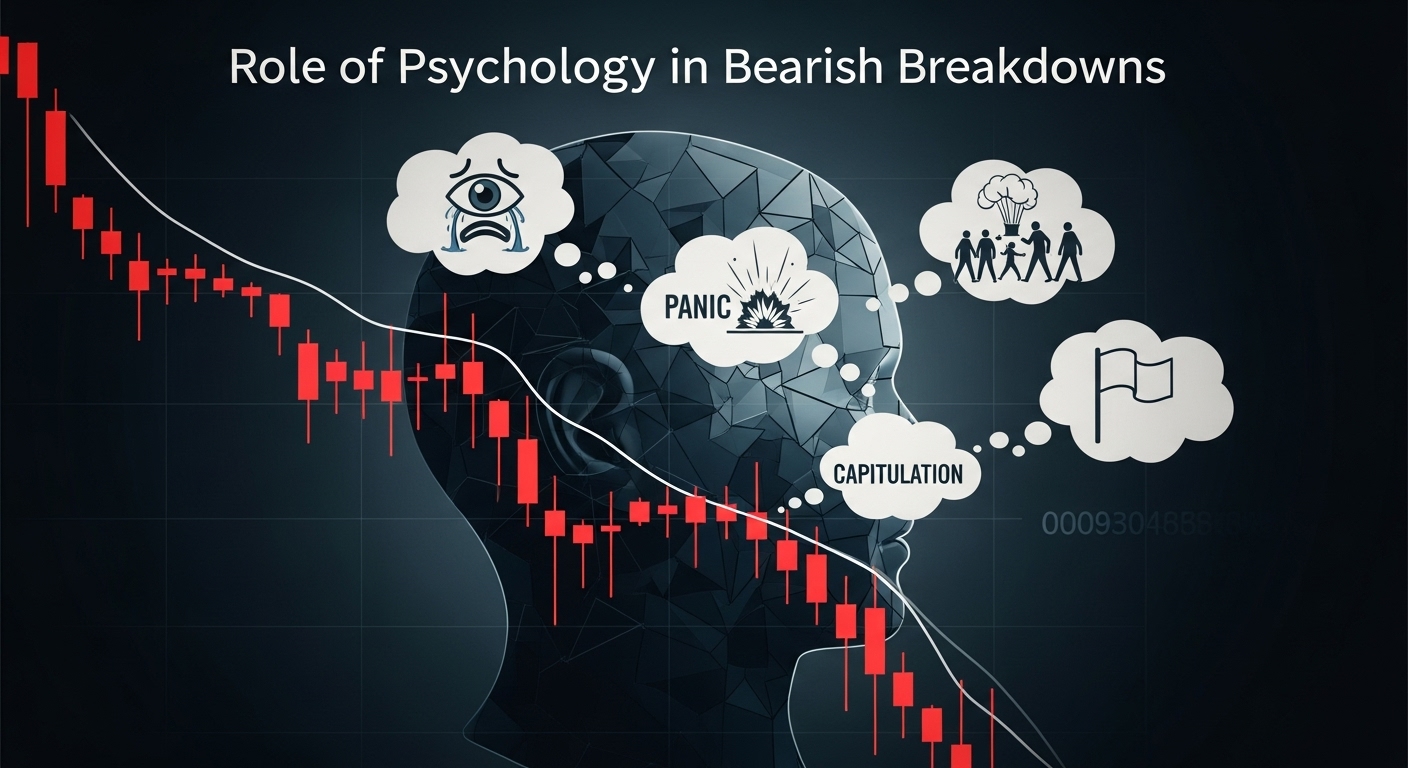
Fear of missing exits and anticipation of lower prices drive selling, accelerating declines. This psychological feedback loop is evident as sellers dump BTC following confirmation. Understanding this dynamic helps explain why breakdowns can be swift and decisive.
What Would Invalidate the Bear Flag Setup
For the bearish Bitcoin price forecast to change, BTC would need to reclaim key resistance levels and hold above them with strong volume. Such a move would suggest that buyers have regained control and that the bear flag breakdown was a false signal. Until then, the burden of proof remains on the bulls.
Long-Term Perspective Despite Short-Term Bearishness
While the short-term outlook appears bearish, Bitcoin’s long-term narrative remains intact for many participants. Bitcoin has endured numerous corrections and bear markets throughout its history, each time emerging stronger in the long run. Separating short-term price forecasts from long-term belief is essential for maintaining clarity during volatile periods.
Conclusion
The current Bitcoin price forecast has turned decisively bearish following the confirmation of a bear flag pattern. As sellers dump BTC and technical indicators align to the downside, the $36K level emerges as a realistic and closely watched target.
Weak momentum, loss of key support, and cautious sentiment all reinforce the bearish outlook. While long-term conviction in Bitcoin remains strong for many, short-term price action suggests that caution is warranted. Bitcoin behaves around $36K will likely define the next chapter, determining whether this move becomes a deeper correction or sets the stage for eventual recovery.
FAQs
Q: Why is the Bitcoin price forecast turning bearish right now?
The Bitcoin price forecast is bearish due to a confirmed bear flag pattern, weakening momentum indicators, loss of key support levels, and increasing selling pressure from short-term traders.
Q: What does a bear flag confirmation mean for BTC price action?
A bear flag confirmation typically signals trend continuation, suggesting that after a brief consolidation, Bitcoin may experience another leg down toward projected targets such as $36K.
Q: Why is the $36K level considered so important?
The $36K level is significant because it aligns with technical projections, historical demand zones, and psychological price levels where buyers and sellers often react strongly.
Q: Can Bitcoin recover quickly after reaching $36K?
A recovery is possible if strong buying volume appears at $36K, but without clear bullish confirmation, any bounce may remain corrective rather than trend-changing.
Q: How should traders and investors approach this bearish phase?
Traders should focus on risk management and technical confirmation, while investors may benefit from patience and a clear understanding of the difference between short-term price forecasts and long-term value.