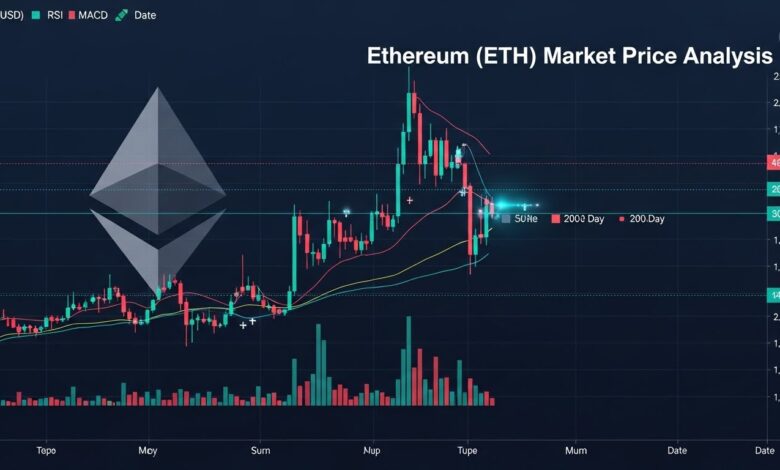
Bullish Ethereum Market Price Analysis: 2.60M ETH at $3,180
Ethereum Market Price Analysis reveals 2.60M ETH at $3,180 and $2,800, mapping key support, resistance and trading strategies for the next move.
The heart of this Ethereum Market Price Analysis is the interplay between price action, on-chain positioning, and macro sentiment. The $3,180 region has repeatedly appeared in technical commentaries as an area of strong activity, acting as either resistance during rallies or support during consolidations. Analysts have noted that breakouts or failures near the $3,150–$3,200 band often define Ethereum’s next mid-term trend.On the downside, the $2,800 level has emerged as a critical buffer during market pullbacks. When Ethereum recently dropped back below $3,000, it was the $2,800 zone
These price bands are not isolated technical lines; they sit within a wider context of:ETF flows and institutional demand, which affect how aggressively big players defend support. Broader crypto market cycles and Bitcoin correlation, which can either amplify or dampen ETH-specific moves. (On-chain signals such as whale accumulation, exchange inflows, and derivatives positioning, all of which contribute to volatility around major levels. With this context in mind, let’s zoom in on how on-chain data explains the 2.60M ETH concentration near these zones.
On-Chain Ethereum Market Price Analysis of the $3,180 Cluster
On-chain metrics like Global In/Out of the Money (GIOM) and cost-basis distribution help identify where large cohorts of ETH holders entered the market. When a significant quantity of coins—such as an estimated 2.60M ETH—cluster around a narrow price band like $3,180, it implies heavy trading activity and a high concentration of cost basis in that region. Tools that segment holder addresses by entry price show similar clusters at key levels for ETH and other assets, reinforcing their importance as liquidity magnets.
Long-Term Holders, Whales, and the $3,180 Zone
Behind every candlestick is a network of participants with different time horizons. In the $3,180 band, on-chain data suggests a mix of:Long-term holders who accumulated ETH during earlier phases of the cycle and are now near or above breakeven.Whales and institutions managing larger tranches, who use these levels to rebalance or hedge their portfolios. Short-term speculators whose entries cluster around breakout attempts above $3,000.When price approaches $3,180, several dynamics can play out simultaneously. Holders who have been underwater may take the opportunity to exit at breakeven, increasing selling pressure.
At the same time, bulls who believe in ETH’s long-term upside may treat dips back into the zone as a chance to increase exposure. This tug-of-war explains why Ethereum support and resistance often look so “sticky” around heavily populated on-chain bands.For traders, the takeaway is that moves through $3,180 tend to be meaningful. Clean breaks above the level with strong volume and low exchange inflows often indicate that supply from frustrated sellers is being absorbed, opening the door to higher resistance targets. Conversely, repeated failures to hold above this zone can hint at distribution—large holders quietly selling into strength.
How the 2.60M ETH Cluster Can Flip Between Support and Resistance
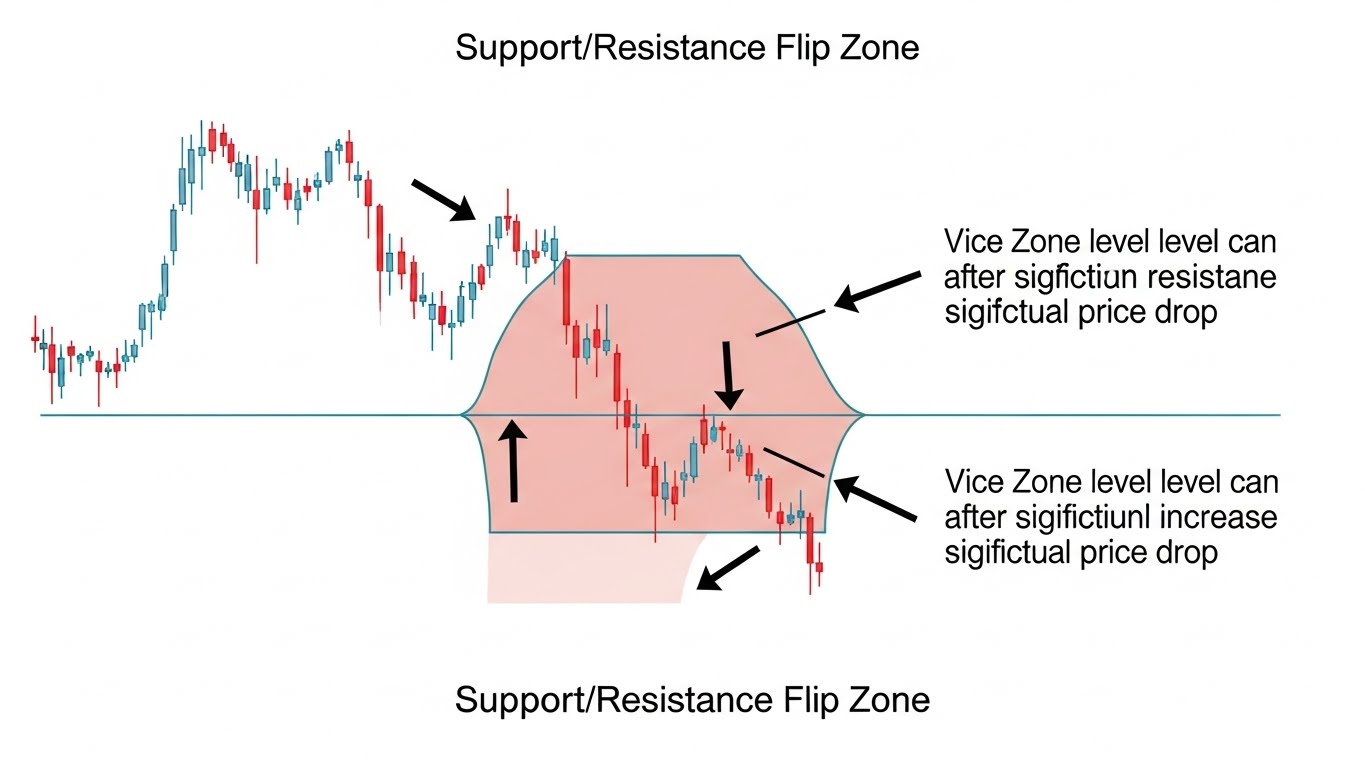
A central idea in technical analysis is that once a resistance level is broken convincingly, it often turns into support on subsequent retests. This concept aligns well with on-chain data. When a price band like $3,180 contains a dense cluster of entries, it can initially cap rallies as many holders sell. But if bulls push through and establish a foothold above the zone, the same cohort may begin to defend it, reluctant to let price fall back below their cost basis.
That’s why, in any serious Ethereum Market Price Analysis, traders watch not only whether $3,180 is touched, but how price behaves around it:Are candles closing above it? Are exchange balances trending down? Are funding rates stable rather than overheated? These clues show whether the 2.60M ETH cluster is acting as a launchpad or a ceiling.
$2,800 as a Critical Ethereum Support Level
While $3,180 may act as a pivot, $2,800 is the safety net currently framing Ethereum’s bullish case. Recent market episodes have shown ETH losing the $3,000 handle but finding buyers near $2,800, where technical and psychological supports converge.
Technical Confluence Around $2,800
The $2,800 area often aligns with important elements on the chart:Retracement zones from previous legs higher.Clusters of historical daily closes and wicks, indicating repeated battles between bulls and bears.Key moving averages such as the 50- or 100-day EMA during certain phases of the trend.
When multiple technical tools point to the same neighborhood, it strengthens the case that this region is not just a random stopping point but a structural support. Furthermore, on-chain cost-basis distribution frequently shows heightened activity near such retracement levels, as value-oriented participants look for “discounts” relative to recent highs.
Macro Sentiment, ETFs, and the Importance of Holding $2,800
The health of the $2,800 floor is also tied to the broader narrative around Ethereum.The launch and adoption of ETH ETFs, which aim to channel traditional capital into spot ETH exposure, have added a new layer of demand but have also created expectations for consistent inflows. Macro factors like interest-rate expectations, regulatory headlines, and the performance of risk assets all influence whether investors are willing to buy dips.
If Ethereum repeatedly bounces from the $2,800 area while ETF flows remain steady or improve, it signals that larger players view this level as fair value or even attractive. However, a decisive break below $2,800 accompanied by rising exchange inflows and negative derivatives funding could indicate that bulls are losing control of the trend.
Trading Scenarios Based on This Ethereum Market Price Analysis
With the 2.60M ETH concentration near $3,180 and the $2,800 support clearly in focus, traders can outline a few potential paths without falling into the trap of over-prediction.
Bullish Scenario: Sustained Breakout Above $3,180
In the bullish case, Ethereum stabilizes above the $3,180 band and turns it into a base for a fresh leg higher. This scenario typically features:Decreasing ETH balances on centralized exchanges as investors opt for self-custody or staking, signaling reduced immediate sell pressure.Healthy but not euphoric funding rates in derivatives markets, showing that leverage is present but not excessively one-sided. Rising on-chain activity in DeFi and NFTs as higher prices encourage more network usage.
Traders who believe in this path often watch for a sequence of higher lows above $3,180 and confirmation from momentum indicators like RSI and MACD. In this context, ETH price prediction models that project targets in the mid-$3,000s and beyond rely on both technical structure and improving fundamentals.Internal readers can complement this outlook with our long-term guide at , where we compare multiple crypto market cycles and discuss potential paths toward higher valuations.
Bearish or Consolidation Scenario: Rejection at $3,180 and Retest of $2,800
A more cautious scenario involves repeated failures to clear and hold above $3,180, followed by a drift or sharp move back to $2,800. Signs supporting this path include:Rising exchange inflows as holders move ETH onto trading platforms, a pattern often seen before increased selling. Weak or negative ETF flows, suggesting that traditional capital is taking profits or pausing new allocations. Deteriorating macro sentiment that pushes investors out of risk assets.
In this context, $2,800 becomes the line in the sand. Holding above it keeps the structure neutral-to-bullish, implying consolidation inside a broader range. Losing it, especially on strong volume, would encourage cautious traders to reassess their risk management, tighten stops, or wait for signs of whale accumulation at lower levels before re-entering.
Fundamentals Behind the Ethereum Market Price Analysis
Price levels alone don’t tell the full story. For a well-rounded Ethereum Market Price Analysis, we must link support and resistance zones to real-world fundamentals.
Ethereum’s Role in DeFi, NFTs and Layer-2 Scaling
Ethereum remains the leading smart-contract network, hosting a vast ecosystem of DeFi protocols, NFT marketplaces, and Layer-2 rollups. The official Ethereum site emphasizes how the network enables programmable money, decentralized applications, and tokenized assets across multiple industries.
Key fundamental drivers include Continued migration of activity to Layer-2 solutions, which reduce gas fees and can potentially boost transaction throughput.Growth in tokenized real-world assets and institutional DeFi products using Ethereum as settlement infrastructure. Upgrades on the Ethereum roadmap targeting scalability, security, and decentralization.When on-chain data shows rising active addresses, healthy fee revenue, and expanding TVL (total value locked) in DeFi, it strengthens the case that support zones like $2,800 represent accumulation rather than distribution.
Market Structure, Liquidity Clusters and Long-Term Outlook
From a structural perspective, ETH’s long-term chart reveals multiple cycles of parabolic advances and deep corrections, similar to other major cryptocurrencies. Historical data sites such as CoinMarketCap highlight how Ethereum’s price has repeatedly built new bases at higher levels over time while experiencing sharp volatility along the way. The presence of liquidity clusters—like the 2.60M ETH around $3,180 and the heavy holdings near $2,800—implies that future moves are likely to gravitate toward these levels
However, Ethereum does face competition from other high-performance chains, and headlines sometimes characterize its current phase as a kind of “midlife crisis” as rivals race to attract users and liquidity. This competitive pressure adds another layer of complexity when interpreting support and resistance: if alternative platforms gain substantial ground, some of the capital clustered around key ETH levels could rotate elsewhere.
Risk Management Within Ethereum Market Price Analysis

Any Ethereum Market Price Analysis that ignores risk is incomplete. The same volatility that offers opportunity can quickly magnify losses, especially for leveraged traders.Practical guidelines often include:Treating major levels like $3,180 and $2,800 as zones, not precise lines, to avoid over-reacting to minor wicks or intraday spikes.Watching on-chain alerts for large exchange inflows or outflows, since big transfers often precede increased volatility. Avoiding decisions based solely on one indicator; combining technical analysis, on-chain data, and macro context tends to produce more robust strategies.
Most importantly, none of this should be taken as financial advice. Many professional analytical sites stress that crypto markets are speculative and that individuals must do their own research and consider their personal risk tolerance before making investment decisions. For a step-by-step approach to position sizing, stop-loss placement, and portfolio diversification,
Conclusion
This extended Ethereum Market Price Analysis has focused on two crucial zones shaped by an estimated 2.60M ETH concentration: the $3,180 pivot and the $2,800 support. On-chain data, technical indicators, and macro narratives all converge to make these levels highly influential in the short- to mid-term outlook.Above $3,180, Ethereum shows the potential for renewed bullish momentum, particularly if ETF flows stay positive, exchange balances trend lower, and on-chain data confirms growing network usage. Below $3,180
but above $2,800, ETH remains in a consolidation regime where traders can expect choppy price action and liquidity-driven swings. Should $2,800 fail convincingly, attention will shift to deeper supports and whether long-term holders step up to absorb selling.In all cases, understanding how whale activity, liquidity clusters, and market sentiment interact around these levels is far more powerful than simply memorizing price points. By combining real-time charts from sources like Ultimately, Ethereum’s story is bigger than any single support or resistance level. But mastering these zones—and the forces behind them—gives you a clearer edge in a market where information and timing matter.
FAQs
1. What does the 2.60M ETH cluster at $3,180 actually mean?
The 2.60M ETH cluster around $3,180 represents an estimated volume of coins whose owners entered or traded heavily near that price band. On-chain tools such as In/Out of the Money Around Price visualize these clusters, showing how many addresses would be in profit or at a loss at different price levels. When a large amount of ETH is concentrated in one band, that zone often behaves as strong support or resistance because many traders react there—either to take profits, cut losses or accumulate more.
2. Why is $2,800 considered such an important support level for Ethereum?
$2,800 has repeatedly emerged as a critical support level in recent months. Technical studies show that dips toward this region tend to attract buyers, while articles tracking ETH price have highlighted $2,800 as a key area where the market tries to stabilize after losing $3,000. This suggests that many participants view $2,800 as a fair entry or re-entry point, and that on-chain cost-basis clusters and liquidity pools reinforce its role as a demand zone.
3. How can I use Ethereum Market Price Analysis in my trading without over-leveraging?
The safest way to use Ethereum Market Price Analysis is as a framework rather than a guarantee. Traders often:
- Map key levels like $2,800 and $3,180 on their charts.
- Wait for confirmation signals like strong volume, healthy funding rates, and decreasing exchange balances before acting.
- Use modest position sizes and clear stop-losses to protect against sudden volatility.
Combining technical analysis, on-chain data, and a disciplined risk plan helps you benefit from insights without exposing yourself to outsized downside.
4. Where can I see live data that supports this Ethereum Market Price Analysis?
You can monitor real-time ETH prices and historical charts on platforms like and For fundamentals and educational resources, provides detailed explanations of how the network works, its roadmap, and how to start using or building on Ethereum.
5. Is this Ethereum Market Price Analysis financial advice?
No. This Ethereum Market Price Analysis is for educational and informational purposes only and should not be interpreted as financial, investment, or trading advice. Many professional analysis platforms explicitly warn that cryptocurrency investing is speculative and involves substantial risk, including the risk of total loss. Always do your own research, consider consulting a qualified financial advisor, and never invest more than you can afford to lose.